
The most useful evaluation criteria reveal whether a platform can preserve the logic of a scenario when assumptions change. Feature checklists often hide this distinction. A tool may produce attractive charts while leaving drivers, dependencies, trigger points, and contingency actions disconnected.
Start with the decision. A product team considering regional expansion might face uncertain demand, regulatory approval, hiring capacity, and infrastructure cost. Those drivers interact. If slower approval delays revenue and raises carrying costs, the tool must represent that relationship rather than store each assumption in an isolated note.
The UK Government Futures Toolkit treats scenarios as structured explorations of plausible futures rather than predictions. That distinction matters in procurement: scenario software should help teams compare credible conditions and responses, not attach false certainty to a preferred forecast.
Use the following criteria as acceptance tests during a live evaluation.
| Criterion | What good looks like | Practical evaluation test |
|---|
| Scenario modeling | Represents best-case, worst-case, and plausible paths with linked drivers | Change one uncertainty and check whether affected paths remain logically consistent |
| Assumption management | Stores assumptions with owners, evidence, status, and review dates | Ask who can identify stale assumptions without reading every scenario |
| Consequence mapping | Connects each option to immediate effects, downstream effects, and reversibility | Trace a decision through operational, customer, financial, and risk consequences |
| Sensitivity analysis | Shows whether the recommendation changes when inputs or weights move | Vary a disputed input across a credible range and observe the decision boundary |
| Collaboration | Supports comments, challenges, approvals, and controlled editing | Run a review with strategy, finance, operations, and risk participants |
| Data integration | Accepts relevant source data without fragile manual transfers | Refresh an input from the system that will own it in production |
| Audit trails | Records who changed an assumption, when, and why | Reconstruct an earlier recommendation after modifying the model |
| Visualization | Makes branching paths and tradeoffs understandable to non-specialists | Ask an uninvolved leader to explain the decision logic from the output |
| Ease of use | Lets regular decision owners maintain the analysis without specialist intervention | Have the future owner create and revise a scenario without vendor guidance |
| Total setup effort | Includes configuration, data preparation, governance, training, and upkeep | Estimate the full operating burden after implementation, not only initial setup |
Assumption management is the decisive criterion for recurring planning. Changing constraints invalidate analysis quickly. If a tool cannot identify which scenarios depend on an altered assumption, the team will either rebuild the model manually or continue using an obsolete recommendation.
Sensitivity analysis also needs careful interpretation. In qualitative planning, it means testing whether a conclusion survives a changed weight, threshold, or constraint. In quantitative systems, it may involve distributions, simulations, or forecast intervals. Teams already using weighted criteria can apply a formal MCDA sensitivity analysis to test whether a preferred option holds.
Procurement should include a challenge session, not just a polished demonstration. Give each vendor the same dilemma, then change a major constraint halfway through. For example, reduce implementation capacity, remove a market, or advance the compliance deadline. Watch what must be rebuilt and what updates automatically.
How do the main scenario planning tools compare?
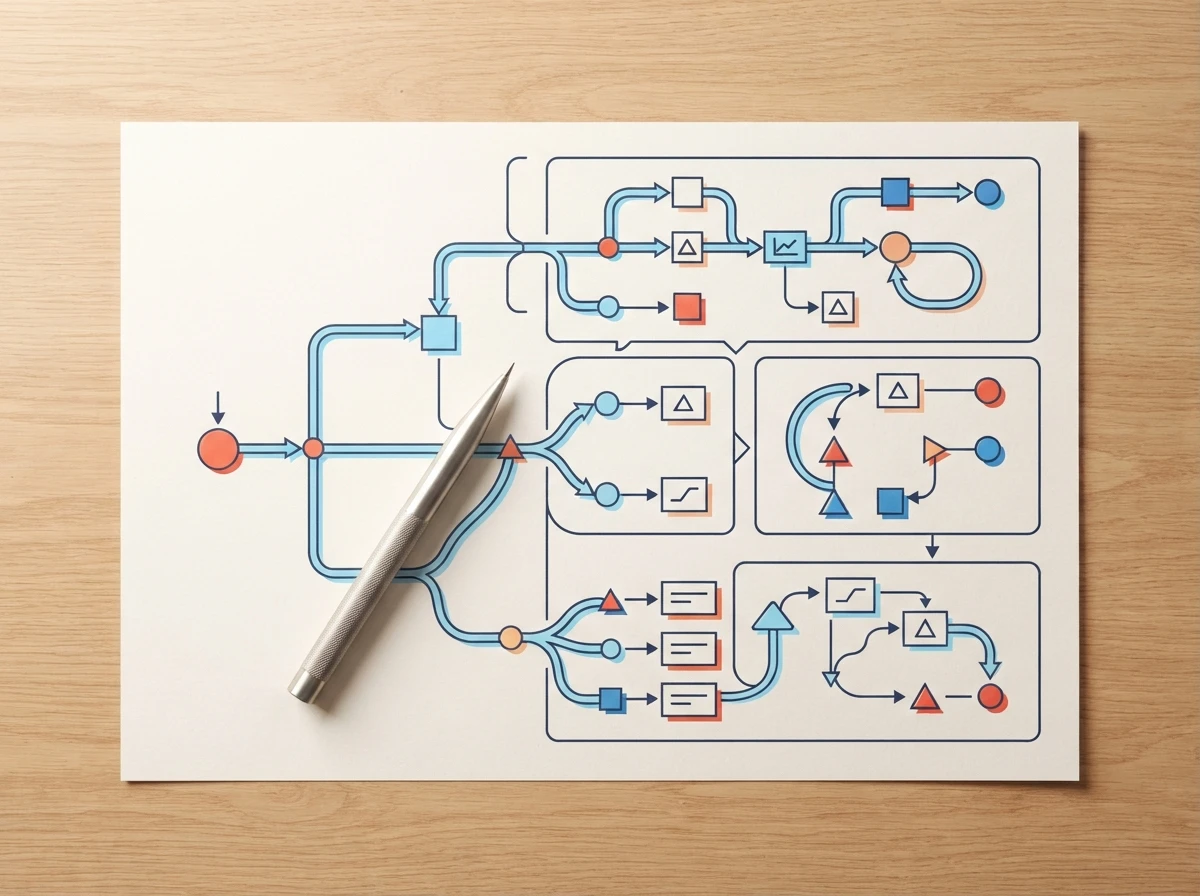
Scenario planning tools generally fall into four practical categories: spreadsheets, AI-assisted decision boards, quantitative modeling platforms, and digital whiteboards. Each category can support uncertainty analysis, but their strengths differ sharply once scenarios need regular updates, defensible assumptions, or data-driven forecasts.
The ratings below describe typical category capabilities rather than every product. Setup effort uses Low as the easiest result, while capability ratings run from Limited to Strong.
| Capability | Spreadsheets | Decision boards | Modeling platforms | Whiteboards |
|---|
| Scenario modeling | Moderate | Strong for qualitative paths | Strong for quantitative models | Moderate for workshop scenarios |
| Assumption management | Moderate if designed well | Strong | Strong | Limited |
| Consequence mapping | Basic | Strong | Moderate | Strong visually |
| Sensitivity analysis | Moderate | Moderate | Strong | Limited |
| Collaboration | Moderate | Strong | Moderate | Strong |
| Data integration |
Spreadsheets suit bounded, owner-led analysis
A spreadsheet works well when inputs are structured, formulas are transparent, and one capable owner controls the model. It is especially effective for scenario-adjusted budgets, capacity plans, unit economics, and deterministic forecasts.
The weakness appears when business logic spreads across hidden cells, copied tabs, and undocumented overrides. Collaboration then becomes file coordination rather than decision review. An Excel model may calculate accurately while giving reviewers no clear route from an assumption to its strategic consequence.
For serious forecasting, teams also need methods that match the data. The open textbook Forecasting: Principles and Practice explains forecast accuracy, time-series structure, prediction intervals, and model evaluation. Those disciplines cannot be replaced by adding optimistic and pessimistic percentages to a baseline.
Decision boards suit changing constraints and explainable tradeoffs
A decision board is useful when the input begins as an unstructured dilemma and the output must expose options, advantages, disadvantages, dependencies, and future consequences. It occupies the space between a free-form workshop and a quantitative forecasting environment.
Lucid, for example, converts written or recorded dilemmas into a color-coded options map, then refines each path when context or constraints change. Grid, Table, and Focus views support different comparison styles. This approach is most relevant when teams need structured reasoning quickly but do not have reliable data for a forecasting model.
For cross-functional use, evaluate the wider requirements in a buyer’s guide to collaborative decision-making software. Permissions, review history, challenge capture, and decision ownership often matter more than the initial diagram.
Quantitative platforms earn their cost when a team has reliable data, specialist ownership, and recurring decisions whose outcomes justify model maintenance. Typical applications include demand forecasting, liquidity stress testing, supply network simulation, and portfolio risk.
These systems can model correlations, distributions, constraints, and feedback loops. They also create a governance obligation. Someone must validate source data, select methods, monitor model drift, document limitations, and explain outputs to decision-makers.
A modeling platform becomes a decision support system (DSS) when it combines data, analytical models, and user controls to support a specific decision process. The label does not guarantee quality. A technically sophisticated DSS can still mislead leaders when its assumptions are stale or its precision exceeds the evidence.
Whiteboards suit facilitated exploration
Digital whiteboards are effective for identifying drivers, clustering uncertainties, drawing scenario narratives, and capturing stakeholder perspectives. The OECD strategic foresight resources emphasize using alternative futures to challenge assumptions and improve preparedness, which aligns well with workshop-led exploration.
Maintenance is the constraint. Once sticky notes become operational commitments, teams need owners, indicators, thresholds, and change history. Whiteboards rarely enforce those controls without a separate process.
Planning maturity reflects how consistently a team defines assumptions, monitors indicators, and connects scenarios to action. Buying above the current maturity level usually creates shelfware. Buying below it leaves analysts maintaining manual workarounds.
| Planning maturity | Typical behavior | Best-fit tool type | Capability to establish next |
|---|
| Ad hoc exploration | Scenarios appear during workshops or crises | Whiteboard or simple decision board | Name drivers, uncertainties, owners, and decision dates |
| Repeatable comparison | Teams compare recurring options using shared criteria | Decision board or controlled spreadsheet | Record assumptions, consequences, and review history |
| Managed planning | Indicators and trigger points are monitored across functions | Decision board with integrations or structured modeling platform | Connect triggers to approved contingency plans |
| Quantitative optimization | Models influence capital, capacity, or portfolio decisions | Specialist modeling platform | Validate models, monitor drift, and govern overrides |
An ad hoc team should first establish a lightweight scenario process. Define the focal decision, identify external drivers, separate relatively stable conditions from critical uncertainties, construct distinct plausible scenarios, and specify what action each scenario would require. A worked scenario planning sample with drivers, paths, and responses shows how to structure that work without starting from software features.
Managed planning requires leading indicators and trigger points. A leading indicator signals that conditions may be moving toward a scenario, while a trigger point defines when the organization changes course. For a supplier concentration risk, an indicator might be deteriorating delivery performance. The trigger could be a contractually meaningful threshold that activates secondary sourcing.
Contingency plans should name an owner, required resources, approval authority, and earliest useful action. Vague responses such as "monitor closely" are not plans. They defer the decision until pressure is highest, when cognitive bias and organizational politics become harder to control. Teams facing that problem can use decision-making bias controls and practical tools to separate evidence changes from preference changes.
Advanced teams may add real options analysis. This approach values flexibility by treating a staged commitment, pilot, delay, expansion right, or exit route as an option rather than forcing an all-or-nothing choice. It is useful when uncertainty resolves over time and management can respond before committing the full investment.
Do not choose a specialized scenario platform when the decision is simple, the analysis will not be repeated, or nobody will own the model after launch. Tool sophistication cannot compensate for absent governance.
A spreadsheet is often enough for a bounded choice with stable criteria and traceable formulas. A whiteboard may be better for a one-time workshop where the main objective is surfacing assumptions and reaching shared understanding. For a short list of options with limited dependencies, a documented analysis of options and recommendation format may provide all the structure required.
Avoid a specialized platform under four conditions:
- No operational owner: Nobody is accountable for reviewing assumptions, indicators, and scenarios.
- Weak source data: Quantitative outputs would amplify missing, inconsistent, or biased inputs.
- Low decision value: The cost of a wrong choice does not justify configuration and maintenance.
- No response authority: The team can detect a trigger but lacks approval or resources to act.
A specialist quantitative system is also the wrong choice when executives want precision that the available evidence cannot support. Wide uncertainty should remain visible. Compressing it into a single forecast makes the output easier to present but less honest.
Run a maintenance test before procurement approval. Ask who will update each input, how often reviews will occur, where evidence will come from, and what happens when the owner changes role. If those questions remain unanswered, improve the planning process before adding software.
Frequently Asked Questions
What is another name for scenario planning?
Scenario planning is also called scenario analysis, scenario development, or strategic foresight. The terms overlap, although strategic foresight may include horizon scanning, trend analysis, and other methods beyond scenarios.
Can you provide a simple example of scenario planning?
A SaaS company considering international expansion might model rapid adoption, slow adoption, and regulatory delay. Each scenario would connect demand, compliance cost, hiring needs, leading indicators, trigger points, and an appropriate market-entry response.
What is a scenario planning process?
A scenario planning process defines the focal decision, identifies drivers and critical uncertainties, builds plausible future conditions, tests strategic options, and assigns indicators and contingency actions. The process should be repeated when evidence or constraints materially change.
What are the main types of scenarios?
Teams commonly use best-case, worst-case, and plausible scenarios, but those labels should describe coherent conditions rather than arbitrary percentage changes. Strong scenarios explain how drivers interact and what evidence would indicate that each future is becoming more likely.
How is scenario planning different from forecasting?
Forecasting estimates likely future values from data and an explicit model. Scenario planning compares multiple plausible futures, including conditions that historical data may not represent, so leaders can prepare actions before uncertainty resolves.
Choose the lightest tool that preserves assumptions, consequences, and decision history at the level your risk requires. If your team needs to turn an unstructured dilemma into comparable paths and revise them as constraints change, register to build the decision in Lucid.


