definition analysis of variance is a way to break down what changed, where it changed, and how much each driver contributed. In decision work, that same “variance thinking” is exactly what separates a statistic tree diagram (probabilities and outcomes) from a decision tree (choices, chance, and consequences). This guide shows how to pick the right “tree,” combine it with a decision matrix, and present branches so stakeholders stop talking past each other.
What is a statistic tree diagram vs a decision tree?
Statistic tree diagram is a probability tool: it maps sequential events where each branch is an outcome with a probability, and the endpoint is a joint probability (often combined with a payoff). The first sentence your team should agree on is: “This is a probability tree, not a decision model.” In practice, it answers questions like “What’s the probability we hit target if A happens then B happens?”
A decision tree is a decision science tool: it maps choices (what we control) and chance events (what we do not), then attaches outcomes like payoff, cost, utility, or risk to the leaves. It is closer to a decision flowchart than a stats diagram because it includes decision nodes (usually squares) and chance nodes (usually circles), plus the logic of “if we choose X, then nature does Y with probability p.”
Here’s the easiest way I’ve found to prevent miscommunication in product and ops reviews: label the artifact at the top with the verb it supports.
Artifact
Primary verb
What “wins”
Typical failure mode
Statistic tree diagram (probability tree)
Predict
Highest likelihood, or probability of a target
People sneak in preferences and call it “the decision”
Decision tree
Choose
Best expected value, or highest expected utility under constraints
Probabilities are made up, so the math looks precise but isn’t
If you want a formal anchor, Wikipedia’s overview of decision trees in decision analysis matches how most orgs draw decision and chance nodes, while probability trees are typically taught under conditional probability and Bayes-style reasoning.
Where definition analysis of variance shows up: once you have outcomes, you can ask “Which branch contributes most to variance in payoff?” That keeps debates grounded in drivers, not vibes.
When should you use probabilities vs criteria scoring?
Probabilities belong in the model when two conditions are true: (1) the uncertainty is external and repeatable enough to estimate, and (2) the decision hinges on distribution, not preference. For example, “supplier lead time misses by more than 2 weeks” is probabilistic if you have historical data.
Criteria scoring belongs in the model when outcomes are multi-dimensional and the “best” option depends on what you value. Product and ops decisions usually live here because speed, risk, customer impact, and engineering cost all matter at once. This is where a rational decision making model and multiple criteria decision analysis (MCDA) are more honest than fake probabilities.
A practical rule I use with teams: if you cannot defend a probability range in a room of skeptics, switch to scoring and be explicit about assumptions.
A worked example: launch timing
Say you’re deciding between “Launch in 2 weeks” vs “Delay 6 weeks.”
A probability tree helps if you have real base rates: probability of incident, probability of churn given incident, probability of rework, and a payoff estimate. You can compute expected value.
A decision matrix helps if the real debate is about strategic posture: brand risk tolerance, roadmap integrity, and support load. You can score and weight.
For probability-based expected value, the math should be transparent and simple. If the tree is so complex nobody can sanity-check it, it will not survive stakeholder scrutiny.
For scoring-based models, keep the scoring scale consistent (for example 1-5) and force the team to write a one-line justification per score. That’s where alignment happens.
You combine a tree with a decision matrix by using the tree to generate scenarios and the matrix to evaluate options across those scenarios. This is the move that stops “tree wars” in cross-functional meetings.
Here’s the workflow we use in practice:
Build a small tree first. Two to four branches max. Name them as decision scenarios stakeholders already recognize (for example: “Demand spike,” “Flat demand,” “Demand dip”).
For each option, write the consequence per scenario in plain language before you touch numbers.
Then choose the evaluation layer:
If consequences are monetary or can be credibly monetized, compute expected value per option.
If consequences are mixed, use a decision making matrix with weighted criteria, and score each option under each scenario.
A compact table often beats a giant tree for decision reviews:
Option
Scenario A: spike
Scenario B: flat
Scenario C: dip
Notes / constraints
Option 1
High upside, high support load
Moderate
Risk of wasted spend
Requires on-call coverage
Option 2
Miss upside
Stable
Best downside protection
Locks vendor for 12 months
This is also where teams confuse a structure tree or solution tree (ways to decompose a problem) with a decision tree (ways to choose under uncertainty). A structure tree is great for root-causing or scoping. It is not sufficient for selecting between strategies.
If your team wants a consistent method across decisions, pairing this with a standard decision framework helps. We wrote a practical guide on how to choose a decision framework for your team that maps common decision types to the right tool.
Where Lucid fits: one board, two views
Most teams maintain a tree in a slide and a matrix in a spreadsheet, then they drift apart within a week. In Lucid, we treat the tree and the matrix as two views of the same underlying decision model: you can keep a branching representation for scenario logic, then switch to a side-by-side grid or table view so tradeoffs and consequences stay consistent as assumptions change.
That “single source of truth” behavior is the real unlock for ops teams that revisit decisions monthly.
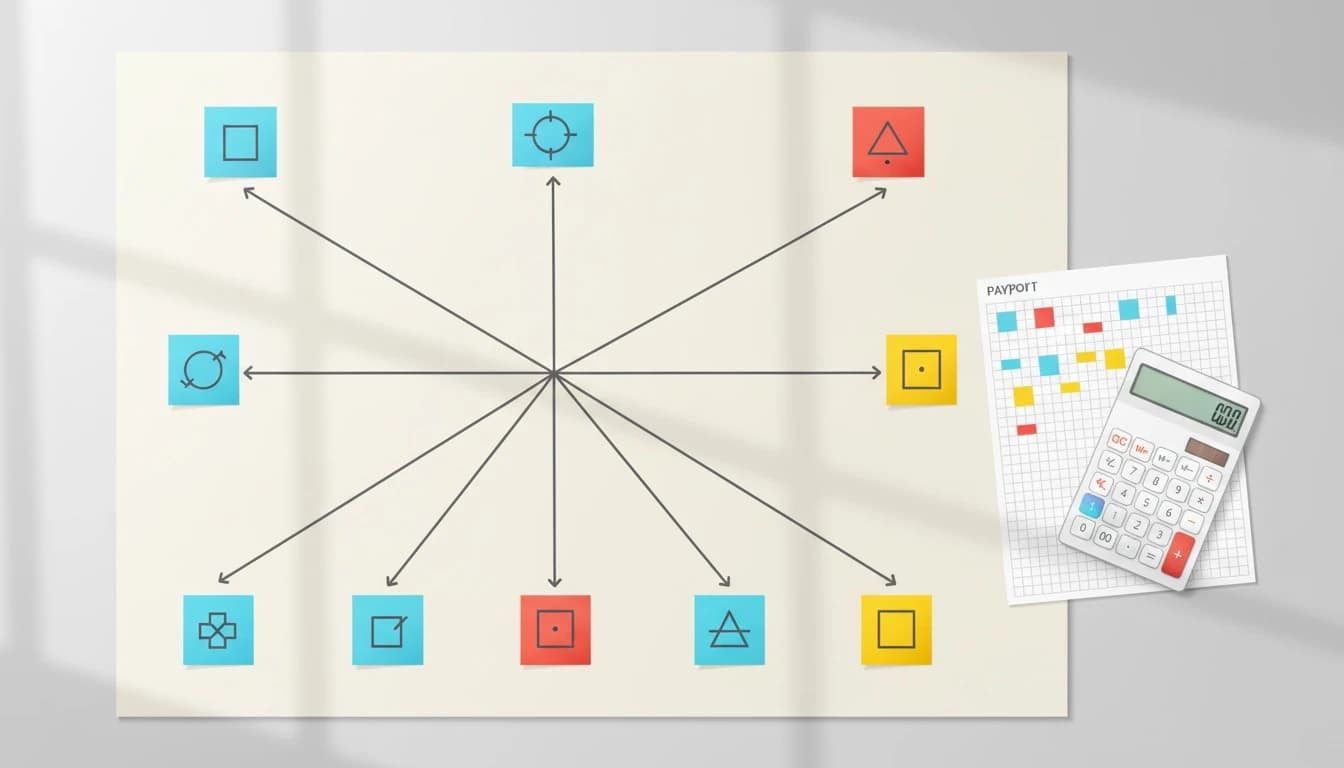
What’s the simplest way to present branches to stakeholders?
The simplest stakeholder-ready tree is one decision node, one chance node, and a summary row that states what would change your mind. Anything more becomes a workshop artifact, not a decision artifact.
I like a 1-page format that reads top-to-bottom:
The decision in one sentence.
The two or three options (branches).
The one uncertainty that matters (chance node).
The outcome metric (payoff, utility, or score).
The constraint that blocks the “obvious” option (budget, headcount, compliance, timeline).
If you need to quantify, keep it to expected value or expected utility and show the numbers that matter. The moment you hide assumptions, stakeholders will attack the model instead of debating the choice.
Two presentation tactics that consistently work for exec reviews:
First, name branches with business language, not model language. “Hire 2 support reps” is better than “Option B.” “Incident rate doubles” is better than “p = 0.2.”
Second, include a variance sentence: “If churn impact is above 1.5%, the best branch flips.” That’s definition analysis of variance applied to decision logic. It tells people where sensitivity lives.
For teams that want a clean visual and a fast narrative, we’ve seen strong results using a decision board format. You can keep the branching logic in a focused view, then pivot into a comparison view for the final recommendation. If you’re building this habit across a product org, our piece on how product managers and UX teams use a personal AI assistant includes workflows that reduce meeting churn and keep decisions documented.
A practical template you can copy for your next decision
Use this template when someone says “let’s do a tree” and you need to clarify which kind.
Field
Fill this in
Tree type
Probability tree (statistic tree diagram) or decision tree
Decision node
What choice do we control?
Chance node
What uncertainty drives outcomes?
Scenarios
2-4 named decision scenarios stakeholders recognize
Outcome
Payoff, expected value, or utility (define the unit)
Constraints
Budget, time, policy, capacity, dependencies
Switch condition
The one assumption that would flip the recommendation
If you want to operationalize it, put the tree and the matrix in the same workspace so updates propagate. That is the difference between a one-off analysis and a reusable decision system. Lucid is built for exactly that: messy inputs in, structured options out, then compare in grid/table/focus views so the tradeoffs are explicit.
Next step: take your current “tree” doc and rewrite the title line to either “Probability Tree: [event]” or “Decision Tree: [choice].” Then add one switch condition. That single sentence will prevent most stakeholder misreads before the meeting even starts.
What are the pros and cons of AI?
AI is fast at generating options, surfacing consequences, and keeping decision logic consistent across updates. The downside is false precision: if inputs are wrong or assumptions are unstated, AI can produce confident but fragile recommendations.
What are the 5 pros and 5 cons of AI?
Pros: speed, breadth of options, consistency, scenario exploration, and documentation. Cons: hallucinated facts, hidden assumptions, over-trust, bias in training data, and weak accountability unless humans own the final decision.
What is the difference between covariance and covariance matrix?
Covariance is a single value describing how two variables move together. A covariance matrix is the table of covariances across many variables, used in multivariate statistics and risk modeling.
What is a decision tree in decision theory?
A decision tree is a structured decision model with decision nodes (choices) and chance nodes (uncertainty), used to compare expected value or expected utility across options. It is most useful when you can defend probabilities or ranges and clearly define payoffs.
Tree Diagram vs Decision Tree: What’s Different? | Lucid