A decision making matrix is how you stop “impact” debates from turning into opinion wars: you define impact metrics, normalize effort, weight criteria, and add confidence so the final ranking survives planning reviews. This playbook shows a repeatable scoring system for an impact vs effort matrix, including calibration examples, uncertainty bands, dependency mapping, and when constraints should override the matrix.
Impact vs effort matrix scoring that holds up in planning reviews
Impact vs effort matrices fail for one predictable reason: teams treat “impact” and “effort” as vibes, not measurable constructs. The fix is to treat the matrix like lightweight decision science: explicit criteria, weights, calibration anchors, and uncertainty.
When I’ve seen prioritization systems survive scrutiny, they share one trait: anyone can ask “why did this beat that?” and you can answer with a short chain of logic, not a louder opinion. If you need a broader set of models beyond a 2x2, keep a reference to Decision Frameworks: the complete guide for when a matrix is the wrong tool.
Which impact metrics should you choose for this quarter?
Which impact metrics should you choose for this quarter? Pick metrics that match the decision horizon and the business constraint you will be judged on in the next planning review. Quarterly prioritization usually breaks when teams mix long-cycle outcomes (brand, platform quality) with short-cycle outcomes (pipeline, activation) and then argue about whose metric “counts.”
Start with 2–4 impact metrics. More than four and scoring becomes theater. Fewer than two and you miss real tradeoffs.
A practical set I’ve used for product and ops teams looks like this:
Impact metric (quarterly)
What “1 point” means (anchor)
When it’s the wrong metric
Revenue or cost impact
$X in expected annualized impact, discounted for probability
If sales cycle is longer than your horizon
Activation or retention lift
+Y% absolute lift on a defined funnel step
If tracking is unreliable or sample size is tiny
Risk reduction
Removes a top-3 operational or security risk
If the risk is hypothetical with no evidence
Strategic enablement
Unblocks Z downstream roadmap items
If dependencies are unclear or speculative
Two things make this defensible.
First, define anchors. An anchor is a real example from your own history. “A score of 5 equals the impact of Project Delta last quarter, which increased activation by 3.2%.” Anchors prevent score inflation and keep metrics vs matrix debates grounded in reality.
Second, weight the metrics. If revenue is the quarterly north star, say so in the math. A simple weighted model is enough:
Criterion
Weight
Score (1–5)
Weighted score
Revenue or cost impact
0.45
4
1.80
Activation or retention lift
0.25
3
0.75
Risk reduction
0.20
2
0.40
Strategic enablement
0.10
5
0.50
Total impact score
3.45
This is the moment where skeptics usually ask, “Isn’t this arbitrary?” The honest answer: the weights are a policy decision, not a statistical truth. What makes it rigorous is that the policy is explicit, reviewed quarterly, and kept consistent within the cycle.
If you want a sanity check on what a decision matrix is doing conceptually, Wikipedia’s overview of a decision matrix is a decent neutral reference to align stakeholders on definitions.
How do you normalize effort across functions?
How do you normalize effort across functions? You stop asking engineering, design, data, and legal to estimate in their native languages and then pretending those numbers are comparable. Normalize effort by converting everything into a single “effort currency” that includes build time plus the hidden tax of coordination.
The approach that holds up best in cross-functional reviews is:
estimate person-weeks (or person-days) by function
The weights matter less than consistency. You can tune them after a quarter if you see systematic bias.
T-shirt sizing that doesn’t collapse under debate
T-shirt sizing works when it is a translation layer, not the estimate itself. Keep XS/S/M/L/XL as the output, but force the input to be person-weeks + complexity + coordination.
A common failure mode: teams label something “M” because it feels medium, then discover it’s actually “M engineering, XL legal.” Normalization prevents that.
If you need your broader team aligned on how to pick and standardize a method, how to choose a decision framework for your team pairs well with this scoring model because it clarifies where consistency matters most.
How do you add confidence and uncertainty to scores?
How do you add confidence and uncertainty to scores? You stop publishing single-point estimates without error bars. A matrix with uncertainty is harder to argue with because it admits what you do not know.
I recommend a simple two-layer model:
Layer 1: Confidence score (0.5x to 1.0x multiplier).
You score confidence separately for impact and effort, then apply it as a multiplier to reduce “fantasy projects” that look great on paper.
Confidence level
Definition
Multiplier
High
Shipped similar work before, data supports impact
1.0
Medium
Some precedent, but key assumptions untested
0.8
Low
New territory, impact depends on multiple unknowns
0.6
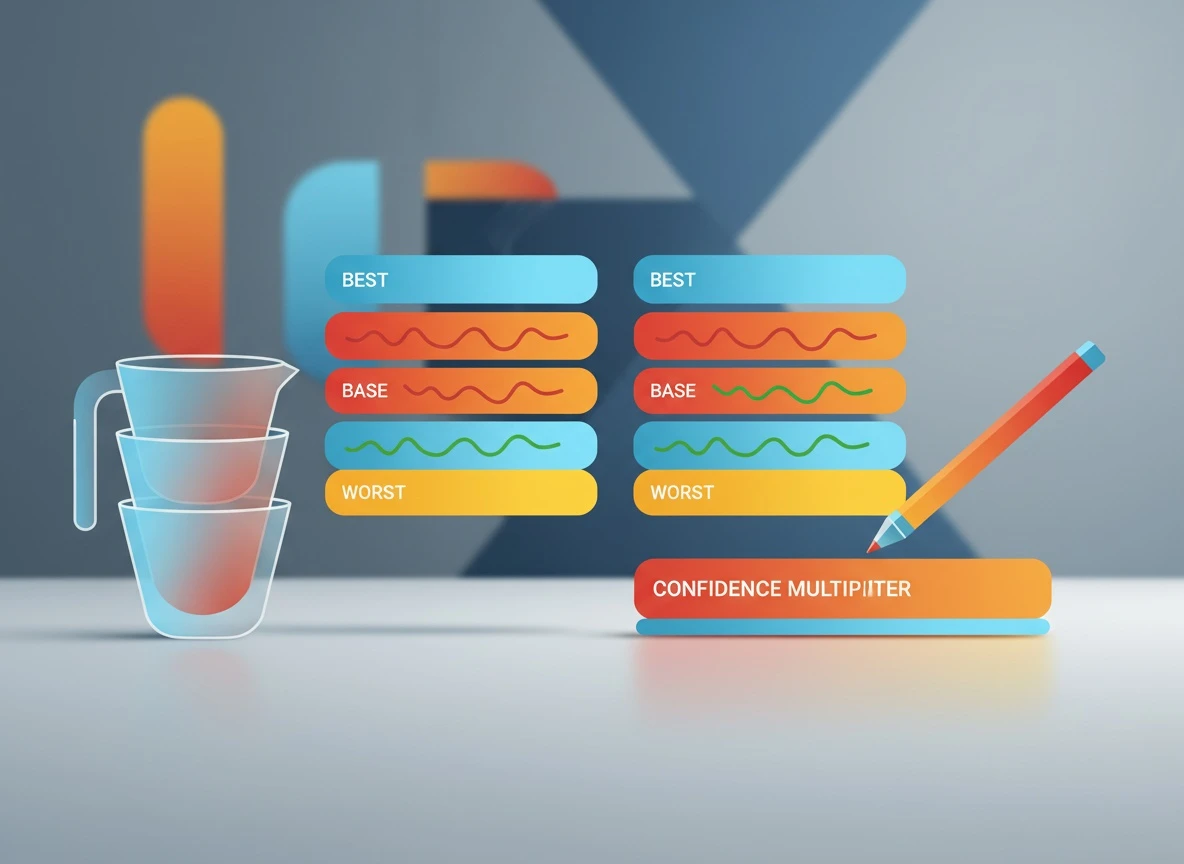
Layer 2: Uncertainty range (best/base/worst).
Use a three-point estimate. For impact, this might be best/base/worst lift. For effort, it might be optimistic/most likely/pessimistic person-weeks. You do not need Monte Carlo to get value here, but if you want the formal math, the Program Evaluation and Review Technique (PERT) is the classic reference.
A pull-quote-worthy rule that has saved me in planning rooms: If two options overlap heavily once you add uncertainty, treat them as tied and decide based on constraints or sequencing, not the matrix rank.
Sensitivity checks: the fastest way to defuse “weight” arguments
Sensitivity checks sound fancy, but the lightweight version is quick: change one weight (for example revenue weight from 0.45 to 0.35) and see if the top 3 reorder. If your ranking flips with small weight changes, your model is unstable and you should not pretend it is precise.
This is where “metrics vs matrix” becomes productive: the matrix is not the truth, it’s a structured way to see what assumptions your decision logic depends on.
When should you override the matrix with constraints?
When should you override the matrix with constraints? Override the matrix when reality makes the top-ranked option infeasible or irresponsible. The key is to treat overrides as first-class, documented constraints rather than backroom exceptions.
The four constraints that most often justify overrides:
Constraint type
Example
How to document it
Hard deadlines
Regulatory requirement by a fixed date
Add a “deadline” flag and date; matrix ranks within deadline bucket
Capacity limits
Only one team can do the work this quarter
Add a capacity constraint and show what gets displaced
Dependencies
Option B unlocks Option A, so B must go first
Dependency mapping and sequencing notes
Risk controls
Security or compliance requires a minimum control set
Add a risk control matrix flag and required mitigations
Dependency mapping is the missing piece in most impact vs effort matrices. A high-impact item that depends on three unstarted foundations is not “high impact this quarter.” It is “high impact later, with prerequisite work now.” That is scenario analysis, not prioritization theater.
A simple way to represent it: for each option, list up to three dependencies and assign a dependency risk flag (low/medium/high). If dependency risk is high, reduce confidence or require a sequencing plan.
If you want this to behave like a decision flowchart rather than a static grid, treat constraints as gates: if an item fails a gate (deadline, compliance, capacity), it cannot be selected regardless of score. That is a cleaner governance model than arguing about why a “low impact” compliance item is being done.
A repeatable scoring workflow (and how Lucid keeps it consistent)
A repeatable system is less about the math and more about keeping one source of truth as context changes. Scores rot when they live in three spreadsheets, two slide decks, and a dozen Slack threads.
Here’s the workflow I’ve used to keep scoring stable across quarters:
Calibrate anchors: pick 3–5 past projects and agree on what “1, 3, 5” means for each impact metric and effort dimension.
Score impact with weights: compute the weighted impact score and write one sentence explaining the driver.
Score effort with normalization: convert cross-functional inputs into one effort score.
Add confidence and uncertainty: apply multipliers and ranges.
Run a sensitivity check: tweak one major weight and see if the top choices change.
Apply constraints and dependencies: sequence work and document overrides.
This is where an AI decision board is genuinely useful, not gimmicky. In Lucid, you can drop a messy dilemma or planning question into an options map, then keep each initiative as a card with the scoring inputs, pros/cons, and future consequences. When scope shifts or new context appears, the board updates without breaking your underlying decision logic.
If your team already uses multiple decision frameworks and wants a consistent way to choose between them, keep Decision Frameworks: the complete guide nearby as a reference library. And if you want to operationalize this into a living board instead of a stale doc, start with a fresh workspace via create a Lucid account.
Frequently Asked Questions
What are the 5 pros and 5 cons of AI for decision making?
Pros: faster scenario exploration, consistent scoring, better documentation, easier sensitivity checks, and improved recall of assumptions. Cons: false confidence in numbers, bias amplification from inputs, over-automation of judgment calls, weak handling of novel edge cases, and privacy risks if data is mishandled.
What are the pros and cons of AI in an impact vs effort matrix?
AI helps draft options, surface missing consequences, and keep a single source of truth as inputs change. It can also tempt teams to accept outputs without auditing assumptions, so you still need anchors, weights, and confidence ranges owned by humans.
How do you calculate the MAP?
If you mean “MAP” as a scoring formula inside a decision matrix, teams usually define it as a weighted sum of criteria (for example, impact criteria weights times scores), optionally adjusted by confidence multipliers. MAP is also used in statistics and medicine with different meanings, so define it explicitly in your planning template.
What is the difference between a decision matrix and an impact vs effort matrix?
A decision making matrix is the broader tool: weighted criteria, scoring, and ranking across many dimensions. An impact vs effort matrix is a simplified 2x2 view that typically compresses many criteria into “impact” and “effort” to support prioritization conversations.
If you want this to hold up in your next planning review, don’t start by scoring new work. Start by calibrating anchors from last quarter, then run one initiative end-to-end through the workflow until your team agrees the logic is fair. When you’re ready to keep everything consistent as context shifts, capture the options, scores, dependencies, and consequences in a Lucid decision board so the reasoning stays intact as the plan evolves.
Impact vs Effort Matrix Scoring That Holds Up | Lucid